North America4 relationships
$217Mcommitted credit
Atlas X · Share of Wallet

See how much business your company provides each bank, how much revolving credit comes back, and where every relationship supports your global operations.
Relationship intelligence
Compare annualized bank business with committed revolving credit, then filter the portfolio by operating region or individual relationship.
Business providedAggregate fees, payments, deposits, FX and custody into one annualized measure.
Credit returnedTrack committed, drawn and available revolving capacity by bank.
Regional coverageTest whether each relationship supports the places where the business operates.
Relationship reciprocity
Atlas X places annualized banking business and committed revolving credit on the same economic basis. The result is a clear reciprocity ratio for every institution—not a subjective scorecard.
Regional relationship coverage
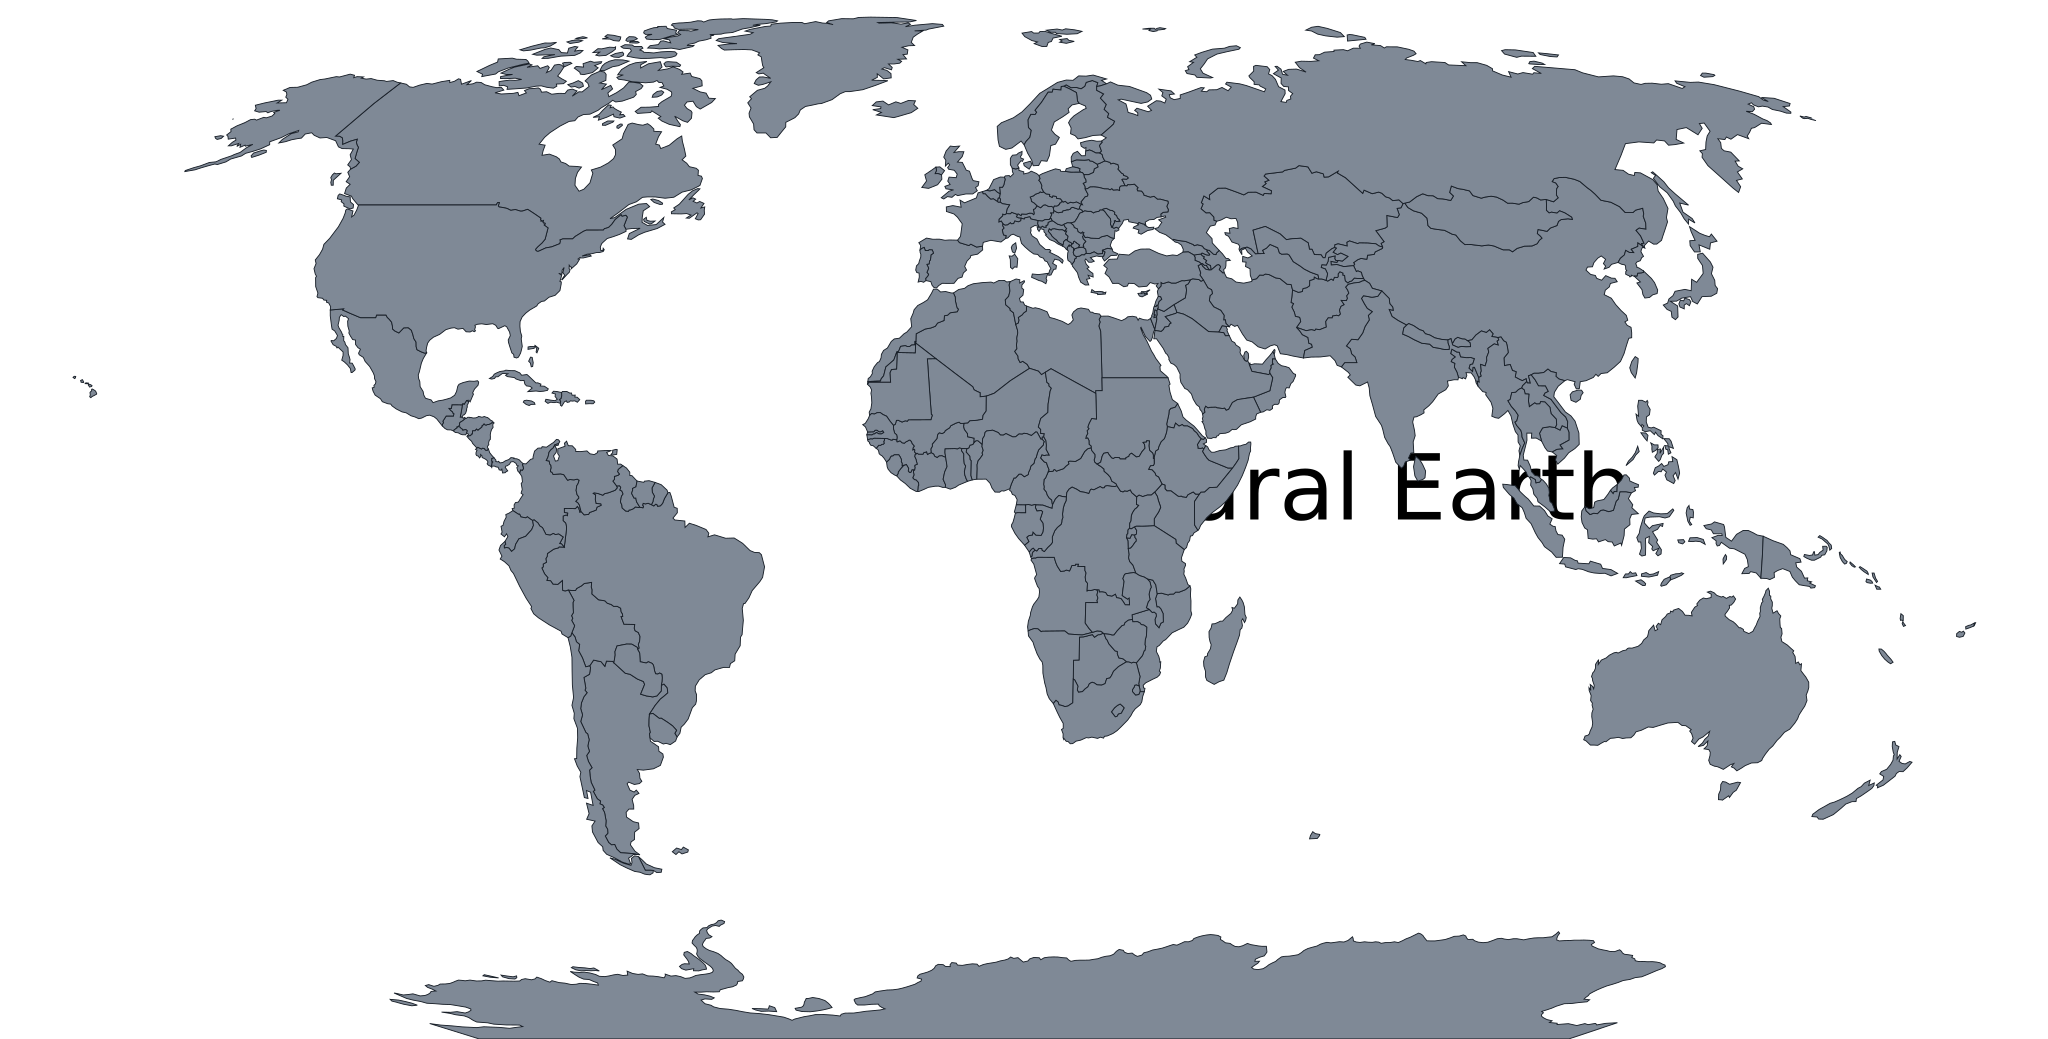
Filter by region to understand which banks support each market and how much committed credit is available to the operating footprint.
$217Mcommitted credit
$152Mcommitted credit
$252Mcommitted credit
$98Mcommitted credit
$218Mcommitted credit
Relationship register
Review business allocation, committed liquidity and regional reach for each bank in one comparable register.
Treasury impact
Compare the economics of every relationship before shifting payments, deposits, FX or custody activity.
See where treasury depends too heavily on one provider, one region or one source of committed liquidity.
Bring a quantified view of business provided and credit returned into renewals and bank negotiations.
Verify that global banking capacity matches the markets, entities and currencies your company actually operates in.
Atlas X Share of Wallet
See business provided, credit returned and available capacity in one working view.